Who are we talking to?
How do people share their views/experiences with us?
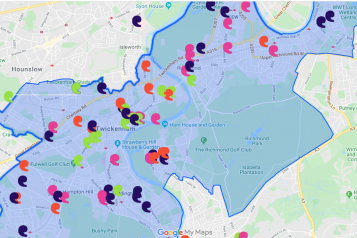
People can share experiences of the NHS and social care with us by phone, email or through our 'Have your say' form. To speak to as many people as possible we also go to over 50 community groups/spaces each year. You can see where we have visited on our outreach map.
We looked at the demographics of people who have shared an experience with us. We want to make sure we are listening to the views of people from all areas of the community.
Age group
- Demographics about age group has been logged in just under 50% of experiences in our database.
- When compared to the Census data (2011), we have proportionally few experiences from people aged 24 years and younger (17% vs. 28% in Census) and proportionally more experiences from those aged 65 years and older (35% vs. 14% in Census).
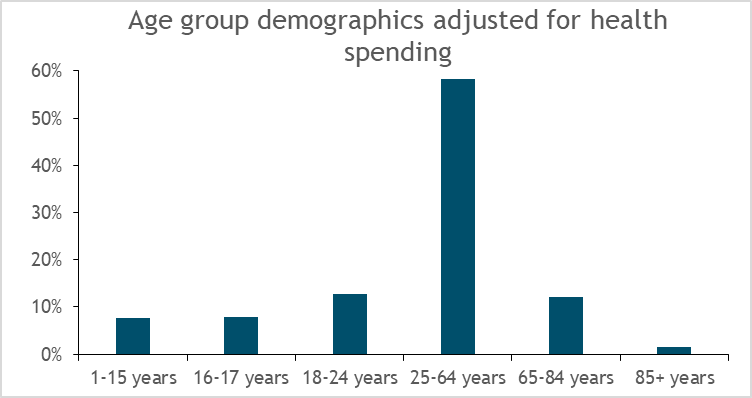
- Healthcare spending increases with age. We have used the predicted spending on health for 2021-22 released by Office of Budget Responsibility to adjust our age group demographics to account for differences in health services usage.
- These adjusted percentages more strongly reflect the population of the Borough.
- We speak to proportionally more people who are the biggest users of the health services.
Gender
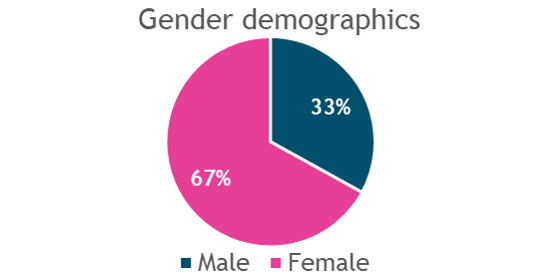
- We have gender demographics for 45% of experiences in our database. We only have records for male and female despite other options being provided (e.g. non-binary, transgender etc)
- According to the Census data (2011) in the Borough there is male: female split of 49% : 51%.
- We collect proportionally more experiences about women and girls (vs. men and boys) as the male: female split for our patient experience database is 33% : 67%.
- We have identified that this gender skew is driven by experiences collected at face to face sessions where more women have engaged with us. However when people contact us by phone or online the male: female split is very even at 51% : 49%.
- The male: female ratio (42% : 58%) was more balanced if we just considered those we provided signposting information to. This means men are more inclined to share experiences with us if they also need information and advice.
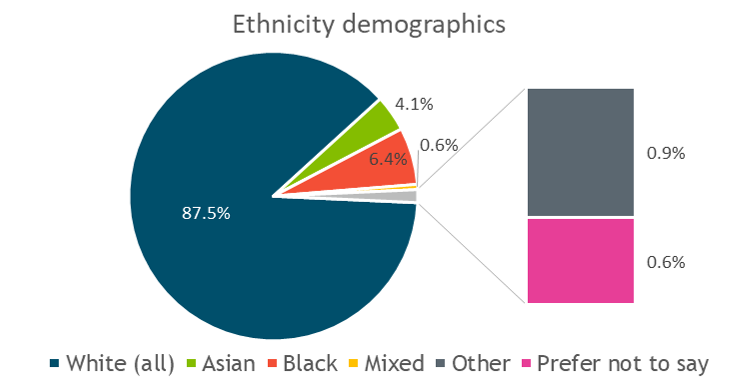
Ethnicity
- We have ethnicity demographic data available for 25% of experiences in our database.
- Comparisons to Census data (2011) shows that our patient experience database is fairly representative of our Borough.
- However mixed ethnicity is underrepresented and we plan to address this in our future outreach work.
- We provide advice and information to proportionally more people from BAME (Black, Asian and Minorty Ethnic) groups.
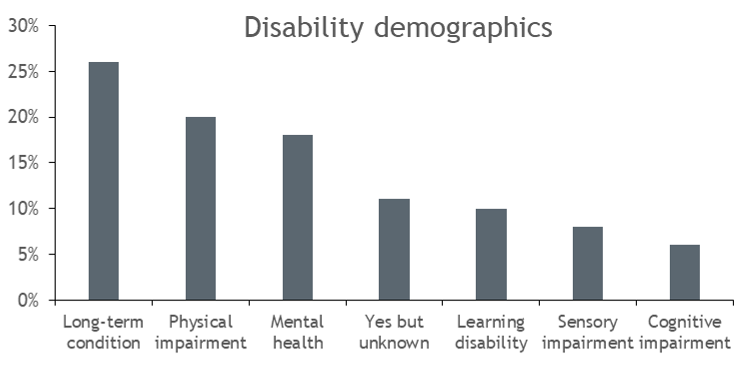
Disability
- A disability was recorded in 11% of experiences in our database. This is comparable as Census data shows that 11% of people in the Borough have assessed that their daily activities were limited a lot or a little by a health problem.
- It has not been possible to find Borough data that is broken down by type of disability to put this any further into context.
Next steps
The demographics of our patient experience database closely matches the community that we serve. Four areas present themselves as opportunities to make improvements to our engagement.
We will take action to reach people from the following groups:
Under 15s
Whilst we are aligned with the Census data in broad age groups, we need to do more to hear about experiences of 1-15 year olds.
Disability groups
A significant number of experiences in our database relate to people with disabilities, and this aligns broadly with the proportion of people with disabilities in the community. However they are relatively high users of health and social care, and more needs to be done to engage them.
LGBTQ+
We do not hold data on sexuality and, of the responses to gender, we only have records for male and female (although other options are provided). There are limited opportunities to engage LGBTQ+ people through groups in Richmond and we are not assured that we have done enough to meet the needs of these groups of people.
Faith Groups
We do not collect data on faith and the lack of non-Christian faith groups in the borough present a risk that we are underrepresented in people of other faiths.
Please note
We started to collect demographic data in September 2018. It is important to note that we do not always collect demographic information, however when information is shared with us it is logged with the experience.